Tracing Power and Network Connectivity
The Power Trace and Network Trace features allow you to navigate your device’s power and data connections.
Connections can be traced using QA: Trace and selecting either Power or Network
Both QA: Power Trace and QA: Network Trace have two panes. The Infrastructure Explorer lists nodes in a tree view. The Trace pane displays the power trace for the selected device.
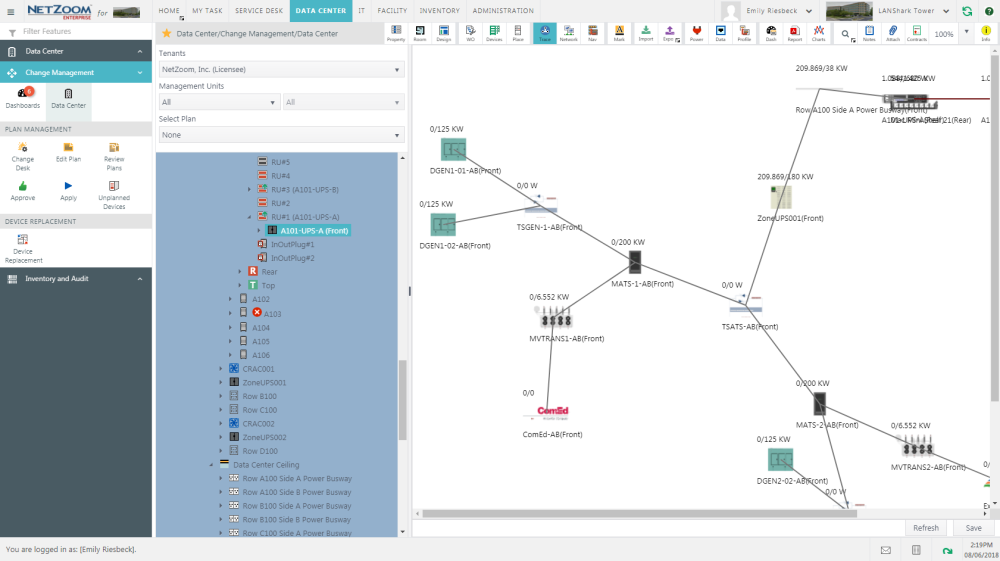
Tracing Device Connectivity
- To trace the connectivity of a device, select it in the Infrastructure Explorer.
- Click on QA: Trace and select Network or Power. That device’s power or network connectivity chain will be displayed in the Trace pane.
- The user can reposition the nodes for improved placement and click the [Save] button. The same placement will be shown the next time the trace is produced for the node.
Navigating Device Connectivity
The Navigate quick action displays the power and network connections for a selected device.
The quick action launches as two panes. When a device is selected, it will appear in the left pane showing a list of ports and connection status, as well as a front and rear view of the device. Selecting a connected port will open the connected device in the right pane, with the connecting port selected.
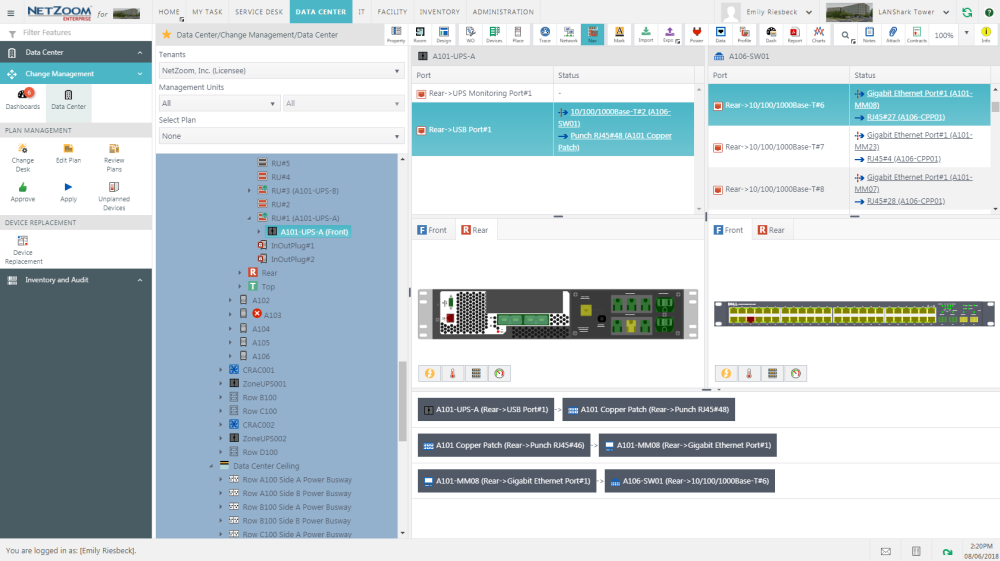
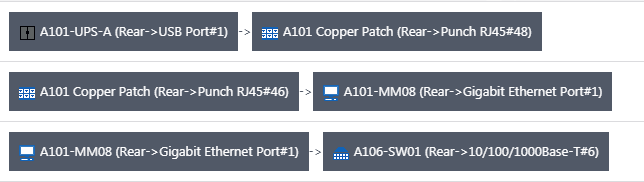
Connectivity Chain
When a connection is selected, the Connectivity Chain will appear on the bottom pane. This will show you connections you have recently navigated to, as well as a hyperlink to each port in the connection chain. Clicking on a hyperlink opens that connection in the quick action.
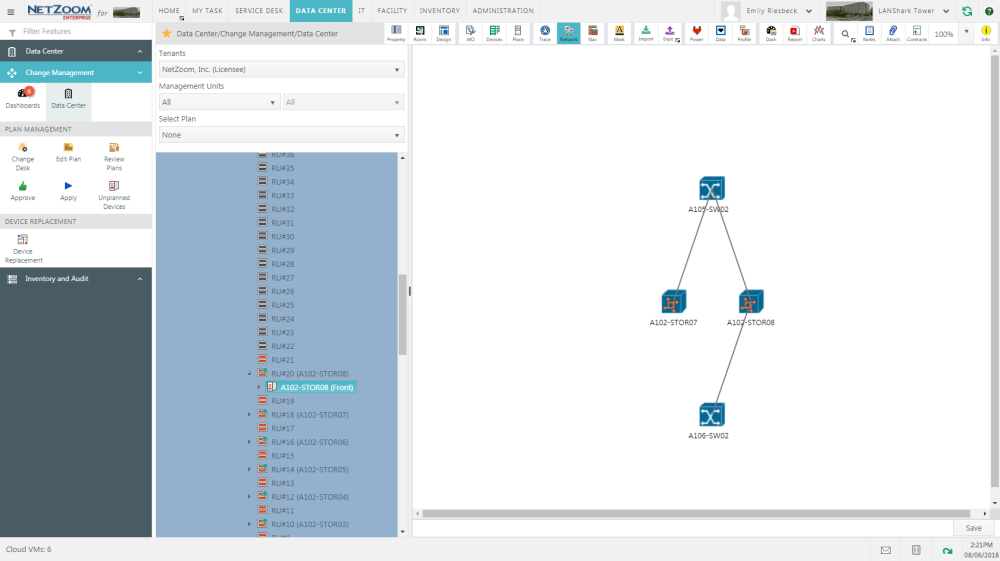
Viewing a Network Diagram
QA: Network Diagram displays a logical network diagram of the data connections for a selected network device. In order for a network diagram to be created, the selected device must be an entity that is assigned to the Network Devices classification group. Entities can be added to this group from Enterprise Settings.